گزارشهای PDF
با استفاده از استودیو، میتوانید گزارشهای PDF موجود را ویرایش کنید (مانند فاکتورها، پیشفاکتورها و غیره) یا گزارشهای جدید ایجاد کنید.
طرح پیشفرض
The default layout of reports is managed outside Studio. Go to , then, in the Companies section, click Configure Document Layout. Layout settings are company-specific but apply to all reports.
نکته
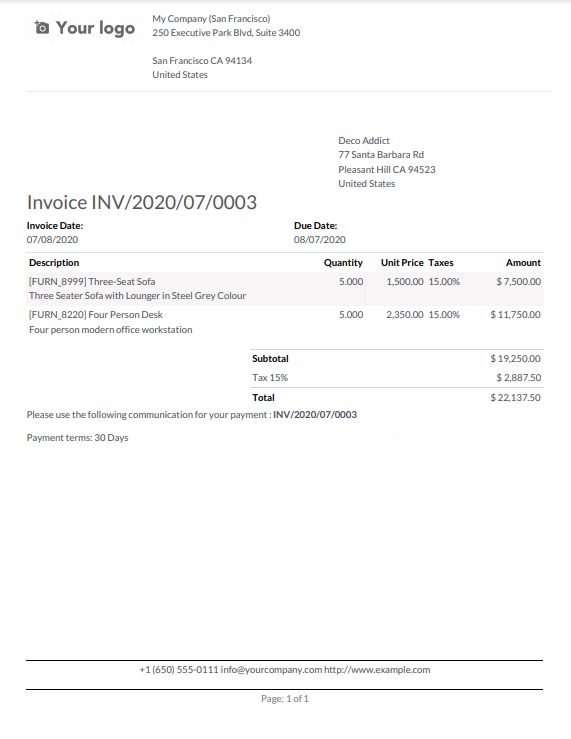
You can see how the different settings affect the report layout in the report preview on the right, or download a sample invoice PDF by clicking Download PDF Preview.
از تنظیمات زیر استفاده کنید:
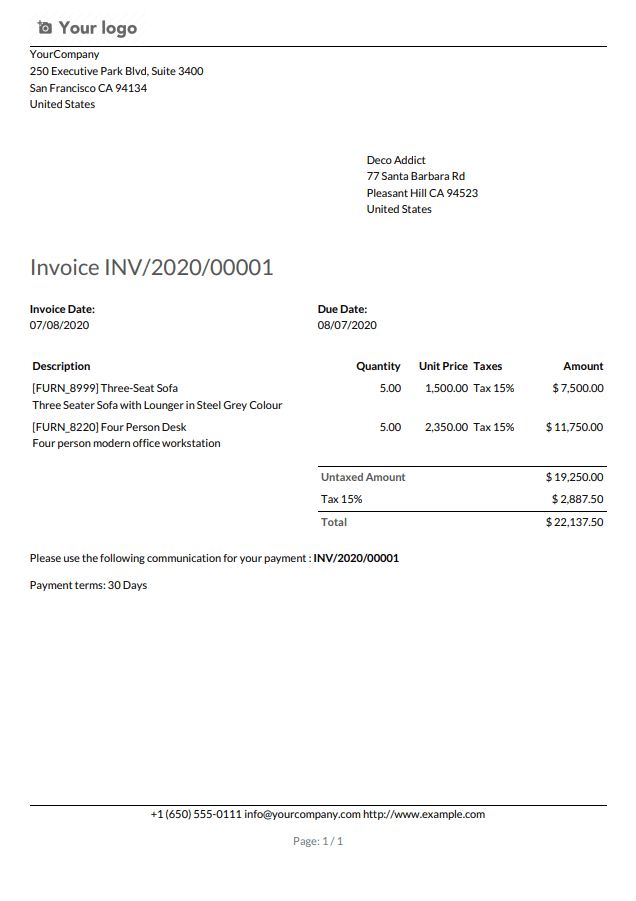
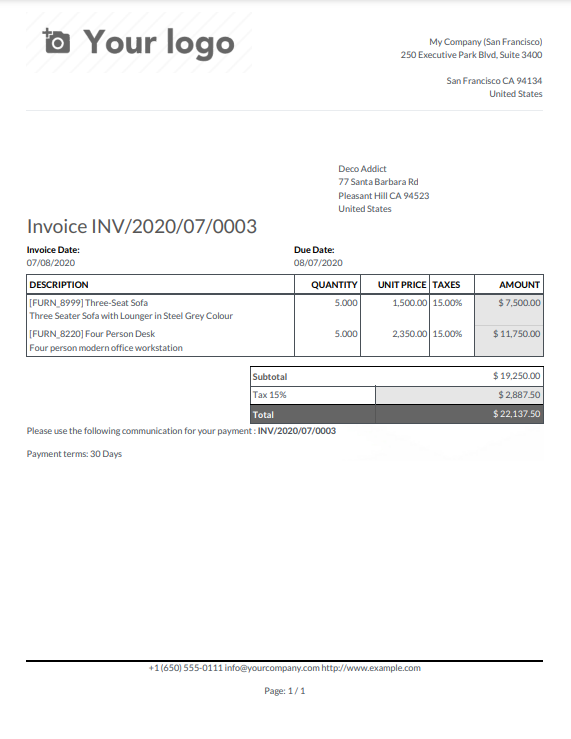
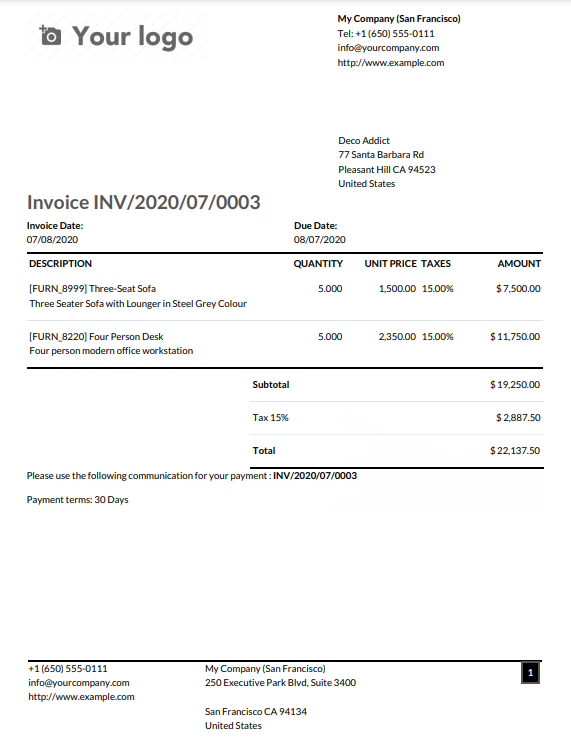
Layout: Four layouts are available:
Font: Seven fonts are available: Lato, Roboto, Open Sans, Montserrat, Oswald, Raleway, and Tajawal (which supports Arabic and Latin scripts). Go to the Google Fonts website to preview them.
لوگوی شرکت: برای آپلود یا تغییر لوگو، روی دکمه ویرایش کلیک کنید. این کار لوگو را به رکورد شرکت در مدل شرکت اضافه میکند که میتوانید با رفتن به و سپس کلیک روی بهروزرسانی اطلاعات در بخش شرکتها به آن دسترسی پیدا کنید.
رنگها: رنگهای اصلی و فرعی مورد استفاده برای ساختار گزارشها را تغییر دهید. رنگهای پیشفرض به طور خودکار بر اساس رنگهای لوگو تولید میشوند.
Layout background: The following backgrounds are available:
خالی: چیزی نمایش داده نمیشود.
هندسی: تصویری حاوی شکلهای هندسی در پسزمینه نمایش داده میشود.
Custom: upload a custom background image.
Company tagline: This is displayed in the header of external reports. You can add multiple lines of text.
Company details: These are displayed in the header of external reports. You can add multiple lines of text.
Paper format: to define the default paper size of reports. You can select A4 (21 cm x 29.7 cm), US Letter (21.59 cm x 27.54 cm), or QR codes page. This can also be defined for individual reports in the Paper format field in Studio.
ایجاد گزارشهای PDF جدید
To create a new report for a model, access the model, click the Toggle Studio button, then click Reports. Click New and, in the popup window that opens, select the type of report. This is solely used to determine what is displayed in the header and footer:
پس از ایجاد گزارش، میتوانید شروع به ویرایش آن کنید.
ویرایش گزارشهای PDF
To access the reports available for a model, access the model (e.g., sales orders), click the Toggle Studio button, then click Reports. Select an existing report to open it or create a new one.
نکته
همچنین میتوانید استودیو را باز کنید، روی گزارشها کلیک کنید و یک گزارش یا مدل خاص را جستجو کنید.
مهم
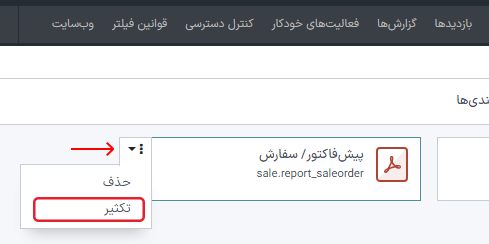
It is strongly recommended to duplicate the standard report and perform changes in the duplicated version. To duplicate a report, hover the mouse pointer on the top right corner of the report, click the vertical ellipsis icon (⋮), and then select Duplicate.
گزینهها
Once you've selected or created a report, you can use the options in the left part of the screen to:
Change the Report name. The new name is applied everywhere (in Studio, under the Print button, and in the PDF file name).
Modify the Paper format. If no value is selected, the format defined in the default layout is used.
Show in print menu: to add the report in the Print menu available from the record.
بارگیری مجدد از پیوست: برای ذخیره گزارش بهعنوان پیوست روی رکورد در اولین باری که تولید میشود و بارگیری مجدد نسخه اصلی گزارش در دفعات بعدی. این مورد برای فاکتورها الزامی است و عمدتاً در این مورد استفاده میشود.
محدود کردن قابلیت مشاهده به گروهها: برای محدود کردن دسترسی به گزارش PDF به گروههای کاربری مشخص.
ویرایش منابع: برای ویرایش مستقیم گزارش در فایل XML.
بازنشانی گزارش: برای کنار گذاشتن تمام تغییرات اعمال شده روی گزارش و بازنشانی آن به نسخه استاندارد.
پیشنمایش چاپ: برای ایجاد و دانلود پیشنمایش گزارش.
ویرایشگر گزارش
The report editor allows you to modify the formatting and contents of the report.
نکته
You can Undo or Redo changes using the related buttons or the shortcuts
CTRL ZandCTRL Y.تغییرات بهطور خودکار هنگام ترک گزارش یا بهصورت دستی با استفاده از دکمه ذخیره، ذخیره میشوند.
میتوانید گزارش را با کلیک روی دکمه بازنشانی گزارش در سمت راست صفحه به نسخه استاندارد بازنشانی کنید.
مهم
ویرایش سربرگ و پابرگ گزارش بر تمام گزارشهای استاندارد و سفارشی تأثیر میگذارد.
بلوکهای شرطی
مستطیلهای خطچین نشاندهندهی بلوکهای شرطی (دستورات if/else) هستند. از این بلوکها برای نمایش یا مخفی کردن محتوا بر اساس شرایط خاص استفاده میشود. برای مشاهدهی شرایط، روی بلوک کلیک کنید.
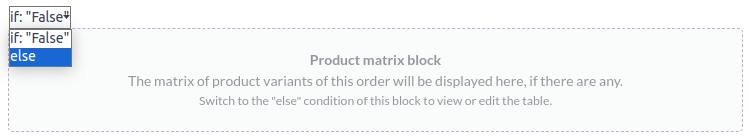
یک مقدار را انتخاب کنید تا خروجی مربوطه را پیشنمایش کرده و در صورت نیاز آن را ویرایش کنید.
توجه
Conditions can only be edited in XML.
سایر محتوا
دو نوع محتوای متنی در گزارشها وجود دارد:
Static text, i.e., the text that's not highlighted in blue, which can be modified directly in the editor.
Dynamic text, i.e., the text that's highlighted in blue, which is replaced by field values when the report is generated, e.g., the SO number or the quotation date.
You can add content (e.g., fields, lists, tables, images, banners, etc.) to the report using
commands. Type / to open the powerbox, then type the command's
name or select it from the list.
برای اضافه کردن متن ثابت به گزارش، متن را در محل مورد نظر تایپ کنید.
برای تغییرات پیشرفتهتر، میتوانید گزارش را مستقیماً در XML ویرایش کنید.
افزودن یک فیلد
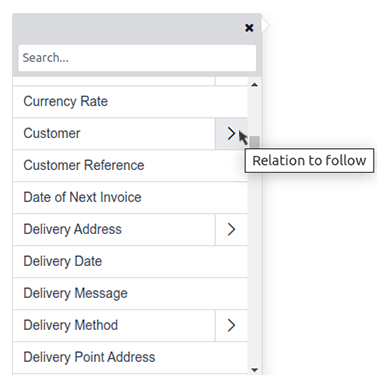
To add a field, type / and select the Field command. In the list that opens, select
or search for the field; click the right arrow next to the field name to access the list of related
fields if needed. Then, specify the default value and press Enter.
Add a data table
Data tables are used to display relational fields. To add
a data table, type /, select the Dynamic Table command, and select the relation to be
displayed in the table.
توجه
Only relations of type one2many or many2many can be displayed as data tables.
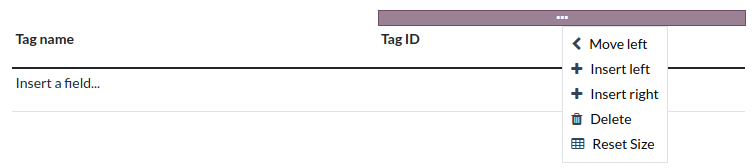
Once the table has been added, you can add columns using the table tools. Position the cursor on top of the column, then click the purple rectangle and select an option.
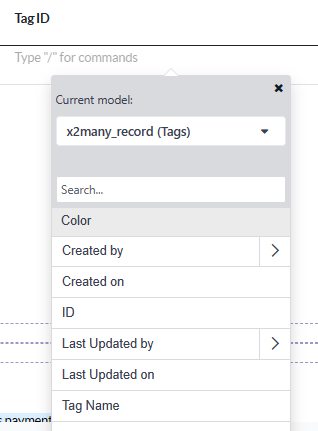
You can then insert the field of your choice in the columns. The dialog box that opens shows the source object for the field (e.g., the Tag model) and the list of available fields.
توجه
The default row automatically iterates over the field's content, generating a row on the report for each field value (e.g., one row per tag). You can add static content rows above or below the generated rows using the table tools.
You can also add data tables by modifying the report's XML.
فرمتبمئی
To format text in the report, select it, then format it using the options in the ویرایشگر متنی.
ویرایش XML گزارش
هشدار
ویرایش مستقیم XML ممکن است باعث ایجاد مشکلاتی در گزارش در حین ارتقاء شود. اگر این اتفاق افتاد، به سادگی تغییرات خود را از پایگاه داده قدیمی به پایگاه داده ارتقا یافته کپی کنید.
برای ویرایش XML گزارش، روی ویرایش منابع در پنل سمت راست کلیک کنید.
مثالها
Sometimes, tables are not properly recognized as such due to complex structures. In those cases, you can still modify them manually in the report XML. For example, with a sales order, you can find the following structure in the XML (simplified for documentation purposes):
<!-- table root element -->
<table>
    <!-- thead = table header, the row with column titles -->
    <thead>
        <!-- table row element -->
        <tr>
            <!-- table header element -->
            <th>Name</th>
            <th>Price</th>
        </tr>
    </thead>
    <!-- table body, the main content -->
    <tbody>
        <!-- we create a row for each subrecord with t-foreach -->
        <tr t-foreach="record.some_relation_ids" t-as="line">
            <!-- for each line, we output the name and price as table cells -->
            <td t-out="line.name"/>
            <td t-out="line.price"/>
        </tr>
    </tbody>
</table>
To modify a table, you must ensure that each row has the same number of data cells. For example, in the case above, you need to add a cell in the header section (with e.g., the column title) and another one in the body section with the field content (usually, with a
t-outort-fielddirective).<table> <!-- table root element --> <thead> <!-- thead = table header, the row with column titles --> <tr> <!-- table row element --> <th>Name</th> <!-- table header element --> <th>Price</th> <th>Category</th> </tr> </thead> <tbody> <!-- table body, the main content --> <tr t-foreach="record.some_relation_ids" t-as="line"> <!-- we create a row for each subrecord with t-foreach --> <td t-out="line.name"/> <!-- for each line, we output the name and price as table cells --> <td t-out="line.price"/> <td t-out="line.category_id.display_name"/> </tr> </tbody> </table>توجه
Cells can span multiple rows or columns. For more information, go to the Mozilla Developer Network website.
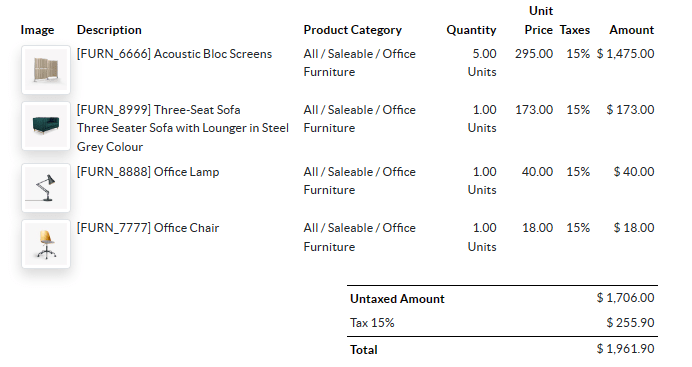
For example, you can modify the Quotation/Order report to add a column to display the product category in the main table:
<table class="table table-sm o_main_table table-borderless mt-4">
    <!-- In case we want to repeat the header, remove "display: table-row-group" -->
    <thead style="display: table-row-group">
        <tr>
            <th name="th_description" class="text-start">Description</th>
            <th>Product Category</th>
            <th name="th_quantity" class="text-end">Quantity</th>
            <th name="th_priceunit" class="text-end">Unit Price</th>
[...]
            <tr t-att-class="'bg-200 fw-bold o_line_section' if line.display_type == 'line_section' else 'fst-italic o_line_note' if line.display_type == 'line_note' else ''">
                <t t-if="not line.display_type">
                    <td name="td_name"><span t-field="line.name">Bacon Burger</span></td>
                    <td t-out="line.product_id.categ_id.display_name"/>
                    <td name="td_quantity" class="text-end">
                        <span t-field="line.product_uom_qty">3</span>
                        <span t-field="line.product_uom">units</span>
                        <span t-if="line.product_packaging_id">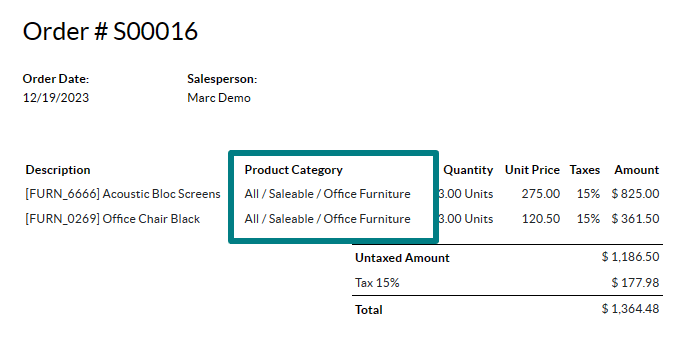
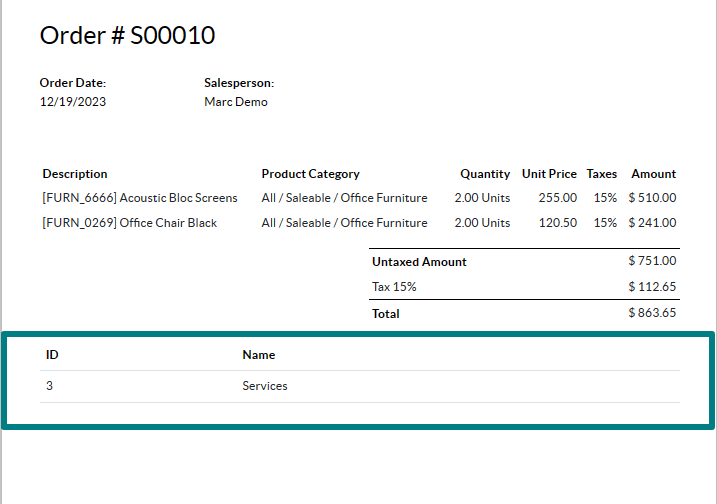
To add a table in XML, you need to know the names of the fields and objects you wish to access and display. As an example, let's add a table that details the tags on a sales order:
<!-- table root element -->
<table class="table">
    <!-- thead = table header, the row with column titles -->
    <thead>
        <!-- table row element -->
        <tr>
            <!-- table header element -->
            <th>ID</th>
            <th>Name</th>
        </tr>
    </thead>
    <!-- table body, the main content -->
    <tbody>
        <!-- we create a row for each subrecord with t-foreach -->
        <tr t-foreach="doc.tag_ids" t-as="tag">
            <!-- for each line, we output the name and price as table cells -->
            <td t-out="tag.id"/>
            <td t-out="tag.name"/>
        </tr>
    </tbody>
</table>
توجه
When adding tables manually, style them using Bootstrap classes, like the table class included in the
example above.
اگر میخواهید محتوا را بر اساس شرایط خاصی نمایش/مخفی کنید، میتوانید به صورت دستی دستورات کنترل if/else را در XML گزارش اضافه کنید.
بهعنوان مثال، اگر میخواهید یک جدول دادههای سفارشی را در صورت عدم وجود برچسب مخفی کنید، میتوانید از ویژگی t-if برای تعیین شرط استفاده کنید، که سپس به عنوان True یا False ارزیابی میشود. اگر در پیشفاکتور برچسب وجود نداشته باشد، جدول نمایش داده نخواهد شد.
<!-- table root element -->
<table class="table" t-if="len(doc.tag_ids) > 0">
    <!-- thead = table header, the row with column titles -->
    <thead>
        <!-- table row element -->
        <tr>
            <!-- table header element -->
            <th>ID</th>
            <th>Name</th>
        </tr>
    </thead>
    <!-- table body, the main content -->
    <tbody>
        <!-- we create a row for each subrecord with t-foreach -->
        <tr t-foreach="doc.tag_ids" t-as="tag">
            <!-- for each line, we output the name and price as table cells -->
            <td t-out="tag.id"/>
            <td t-out="tag.name"/>
        </tr>
    </tbody>
</table>
اگر میخواهید در صورتی که عبارت t-if به عنوان False ارزیابی شود، بلوک دیگری نمایش داده شود، میتوانید آن را با استفاده از عبارت t-else مشخص کنید. بلوک t-else باید مستقیماً پس از بلوک t-if در ساختار سند قرار گیرد. نیازی به تعیین شرطی در ویژگی t-else نیست. بهعنوان مثال، بیایید یک پیام سریع نشان دهیم که توضیح میدهد در پیشفاکتور برچسبی وجود ندارد:
<!-- table root element -->
<table class="table" t-if="len(doc.tag_ids) > 0">
    <!-- thead = table header, the row with column titles -->
    <thead>
        <!-- table row element -->
        <tr>
            <!-- table header element -->
            <th>ID</th>
            <th>Name</th>
        </tr>
    </thead>
    <!-- table body, the main content -->
    <tbody>
        <!-- we create a row for each subrecord with t-foreach -->
        <tr t-foreach="doc.tag_ids" t-as="tag">
            <!-- for each line, we output the name and price as table cells -->
            <td t-out="tag.id"/>
            <td t-out="tag.name"/>
        </tr>
    </tbody>
</table>
<div class="text-muted" t-else="">No tag present on this document.</div>
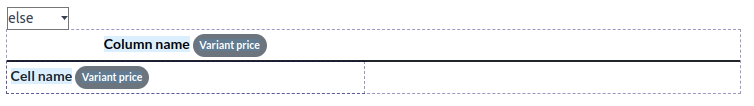
با استفاده از آیکون t-if/t-else، ویرایشگر گزارش تشخیص میدهد که این بخشها به صورت متقابل انحصاری هستند و باید به عنوان بلوکهای شرطی نمایش داده شوند:
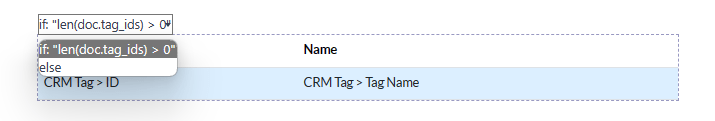
میتوانید با استفاده از ویرایشگر شرایط را تغییر دهید تا خروجی آنها را پیشنمایش کنید:

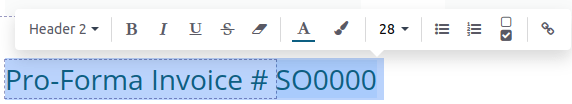
اگر میخواهید چند گزینه داشته باشید، میتوانید از دستورات t-elif برای افزودن شرایط میانی استفاده کنید. بهعنوان مثال، عنوان گزارشهای سفارش فروش بر اساس وضعیت سند پایه تغییر میکند.
<h2 class="mt-4">
    <span t-if="env.context.get('proforma', False) or is_pro_forma">Pro-Forma Invoice # </span>
    <span t-elif="doc.state in ['draft','sent']">Quotation # </span>
    <span t-else="">Order # </span>
    <span t-field="doc.name">SO0000</span>
</h2>
عنوان پیشفاکتور بسته به برخی شرایط زمینهای استفاده میشود. اگر این شرایط برآورده نشود و وضعیت سند پیشنویس یا ارسال شده باشد، از پیشفاکتور استفاده میشود. اگر هیچیک از این شرایط برآورده نشود، عنوان گزارش سفارش خواهد بود.
Working with images in a report can be challenging, as precise control over image size and
behavior is not always obvious. You can insert image fields using the report editor
(by using the /Field command), but inserting them in XML
using the t-field directive and accompanying t-options attributes provides better sizing and
positioning control.
بهعنوان مثال، کد زیر فیلد image_128 محصول سطر را به شکل یک تصویر 64 پیکسلی (با ارتفاع خودکار بر اساس نسبت ابعاد تصویر) خروجی میدهد.
<span t-field="line.product_id.image_128" t-options-widget="image" t-options-width="64px"/>
گزینههای زیر برای ویجتهای تصویر موجود است:
width: عرض تصویر، معمولاً بر حسب پیکسل یا واحدهای طول CSS (مانندrem) (برای عرض خودکار خالی بگذارید).height: ارتفاع تصویر، معمولاً بر حسب پیکسل یا واحدهای طول CSS (مانندrem) (برای ارتفاع خودکار خالی بگذارید).class: کلاسهای CSS اعمال شده روی تگimg؛ کلاسهای Bootstrap در دسترس هستند.alt: متن جایگزین تصویرstyle: ویژگی استایل؛ این امکان را به شما میدهد که استایلها را آزادانهتر از کلاسهای Bootstrap بازنویسی کنید.
این ویژگیها باید شامل رشتههایی باشند، یعنی متنی که درون علامت نقل قول قرار گرفته است، بهعنوان مثال، t-options-width="'64px'" (یا یک عبارت معتبر پایتون).
توجه
ویجت تصویر را نمیتوان روی تگ img استفاده کرد. در عوض، دستور t-field را روی یک گره span (برای محتوای درونخطی) یا div (برای محتوای بلوکی) تنظیم کنید.
بهعنوان مثال، بیایید یک ستون با تصویر محصول به جدول پیشفاکتور اضافه کنیم:
<table class="table table-sm o_main_table table-borderless mt-4">
    <thead style="display: table-row-group">
        <tr>
            <th>Image</th>
            <th name="th_description" class="text-start">Description</th>
            <th>Product Category</th>
            <th name="th_quantity" class="text-end">Quantity</th>
            <th name="th_priceunit" class="text-end">Unit Price</th>
[...]
        <t t-foreach="lines_to_report" t-as="line">
            <t t-set="current_subtotal" t-value="current_subtotal + line.price_subtotal"/>
            <tr t-att-class="'bg-200 fw-bold o_line_section' if line.display_type == 'line_section' else 'fst-italic o_line_note' if line.display_type == 'line_note' else ''">
                <t t-if="not line.display_type">
                   <td>
                       <span t-field="line.product_template_id.image_128"
                             t-options-widget="'image'"
                             t-options-width="'64px'"
                             t-options-class="'rounded-3 shadow img-thumbnail'"
                           />
                   </td>
                    <td name="td_name"><span t-field="line.name">Bacon Burger</span></td>
                    <td t-out="line.product_id.categ_id.display_name"/>
ویژگی t-options-width عرض تصویر را به 64 پیکسل محدود میکند و کلاسهای Bootstrap استفاده شده در t-options-class یک حاشیه شبیه به تصویر کوچک با گوشههای گرد و سایه ایجاد میکنند.